
Reports overview
How to use this page
Section titled “How to use this page”Open Reports (Reports) when you want more than a dashboard snapshot. Start on General for overall KPIs, then use the other tabs for day/time, price, tags, options, or symbols. Keep the same date range and filters as the dashboard so numbers stay consistent.
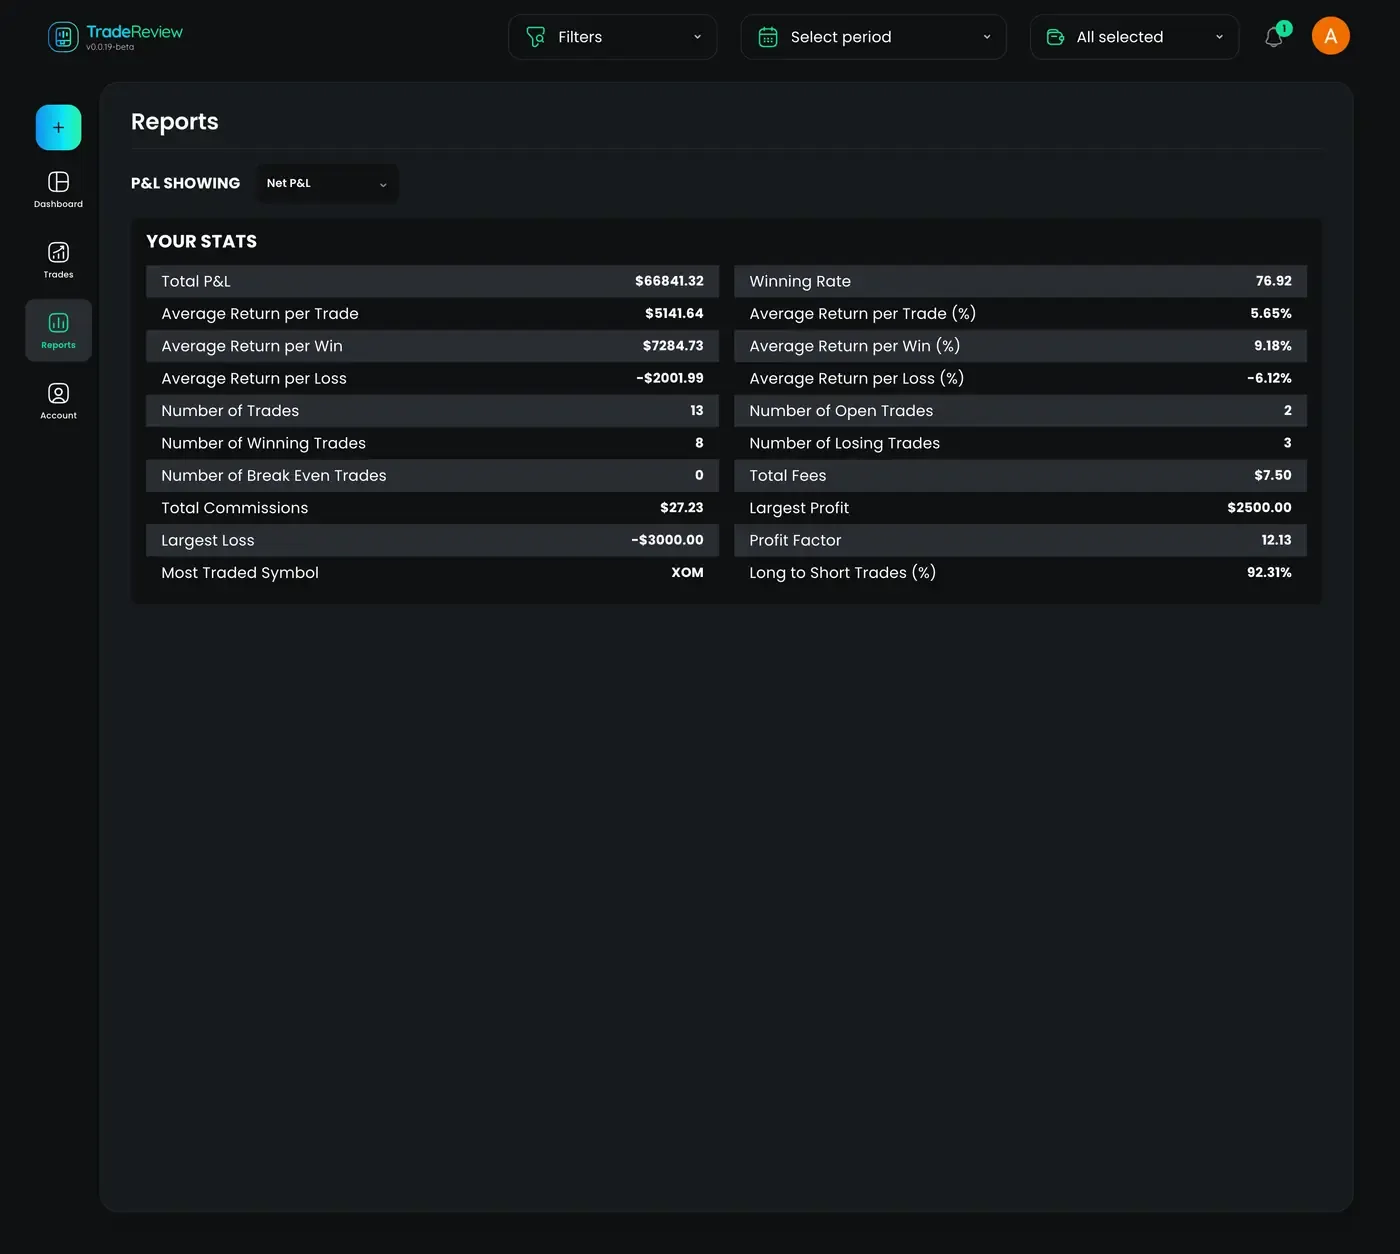
Report tabs
Section titled “Report tabs”| Tab | Use it to… | Guide |
|---|---|---|
| General | Overall P&L and performance KPIs | General report |
| Day & Time | Performance by day, month, hour, duration | Day and time report |
| Price | Results by entry/exit price intervals | Price report |
| Tags | Compare tagged setups and mistakes | Tags report |
| Options | Call/Put, DTE, expiration patterns | Options report |
| Symbols | Best and worst tickers | Symbols report |
Key metrics in reports
Section titled “Key metrics in reports”1. Profit & Loss Metrics
Section titled “1. Profit & Loss Metrics”- Total P&L – Overall profit or loss from all trades.
- Largest Profit – The highest profit made from a single trade.
- Largest Loss – The biggest loss incurred in a single trade.
- Profit Factor – The ratio of total profit to total loss.
2. Performance Metrics
Section titled “2. Performance Metrics”- Winning Rate – Percentage of trades that ended in profit.
- Average Return per Trade – The mean profit or loss per trade.
- Average Return per Trade (%) – The average return percentage per trade.
- Average Return per Win – Mean profit from winning trades.
- Average Return per Win (%) – The average percentage gain per winning trade.
- Average Return per Loss – Mean loss from losing trades.
- Average Return per Loss (%) – The average percentage loss per losing trade.
3. Trade Count & Distribution
Section titled “3. Trade Count & Distribution”- Number of Trades – Total number of executed trades.
- Number of Open Trades – Trades that are still active.
- Number of Winning Trades – Trades that resulted in a profit.
- Number of Losing Trades – Trades that resulted in a loss.
- Number of Break Even Trades – Trades that ended with no net gain or loss.
- Long to Short Trades (%) – Percentage of long vs. short trades executed.
- Most Traded Symbol – The asset that has been traded the most.
4. Cost Analysis
Section titled “4. Cost Analysis”- Total Fees – The total amount spent on trading fees.
- Total Commissions – The total commissions paid to brokers.
Breakeven classification can be tuned in Trade settings.