
Compare report
How to use this page
Section titled “How to use this page”Open Reports → Compare (Compare). Use it to put two slices of your journal next to each other — last month vs this month, long vs short, one setup vs another — and see what changed.
Set up a comparison
Section titled “Set up a comparison”Step 1: Open Comparison setup. By default, Group 1 is last month and Group 2 is this month up to today.
Step 2: Set the filters for Group 1 and Group 2. Each group can use:
- Symbol
- Tags — trades with any of the selected tags
- Strategy — shown when you have strategies
- Type
- Side
- Result
- Date
- Account
Step 3: Select Generate report. The setup panel closes and a short G1 / G2 summary of each group appears.
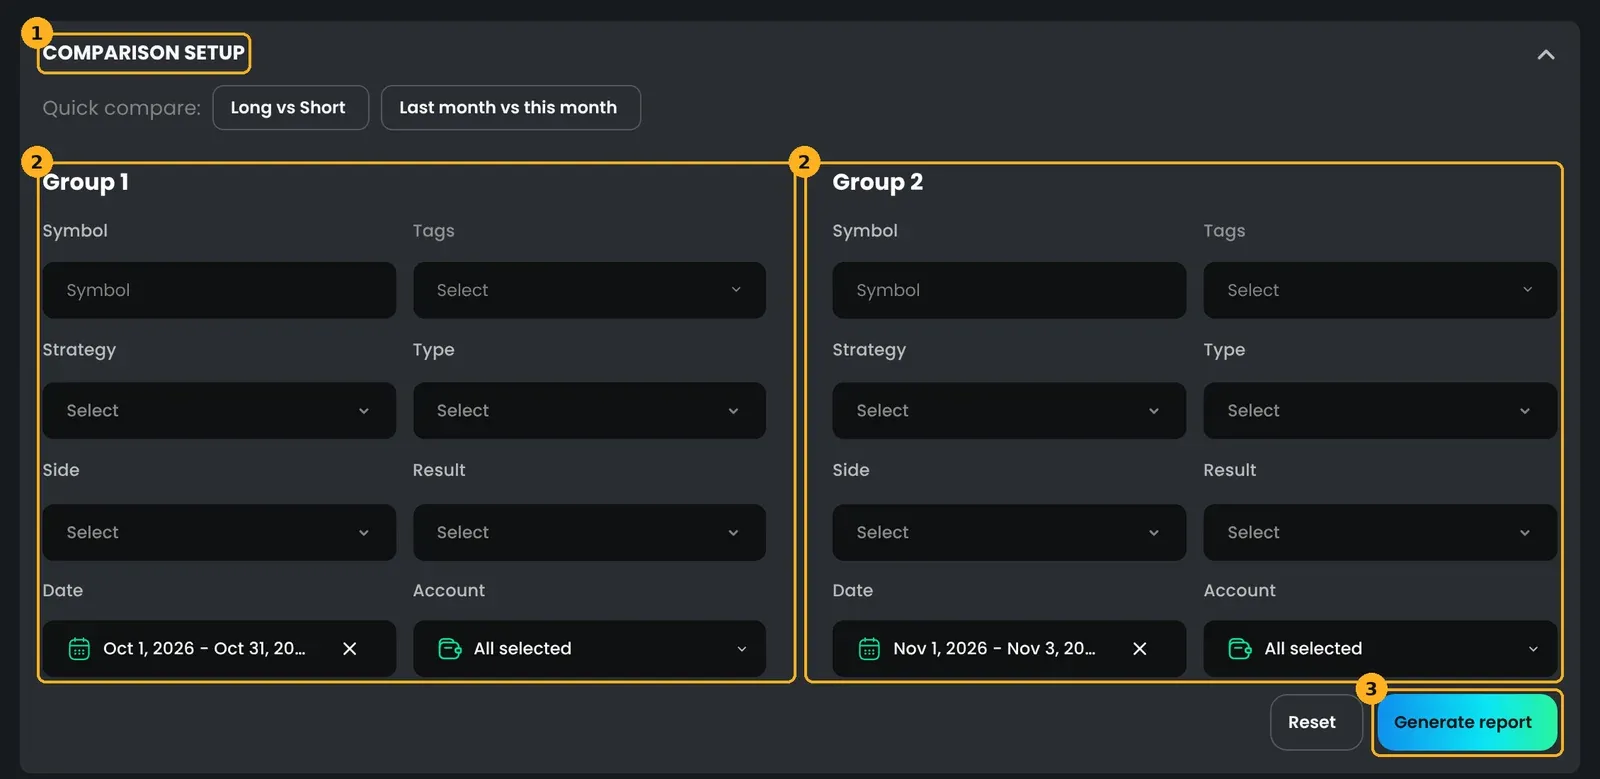
If you change filters after generating, you will see “Filters changed — generate the report again to update results.” Select Generate report again.
Select Reset to go back to the default groups (last month vs this month) and clear the results.
Quick compare
Section titled “Quick compare”Under Quick compare:, one click fills both groups and runs the report:
- Long vs Short — all long trades vs all short trades, with no date limit
- Last month vs this month — the default date groups
Net or Gross
Section titled “Net or Gross”Use the Net / Gross toggle to switch the metrics table and the outcome charts between net and gross P&L.
Charts
Section titled “Charts”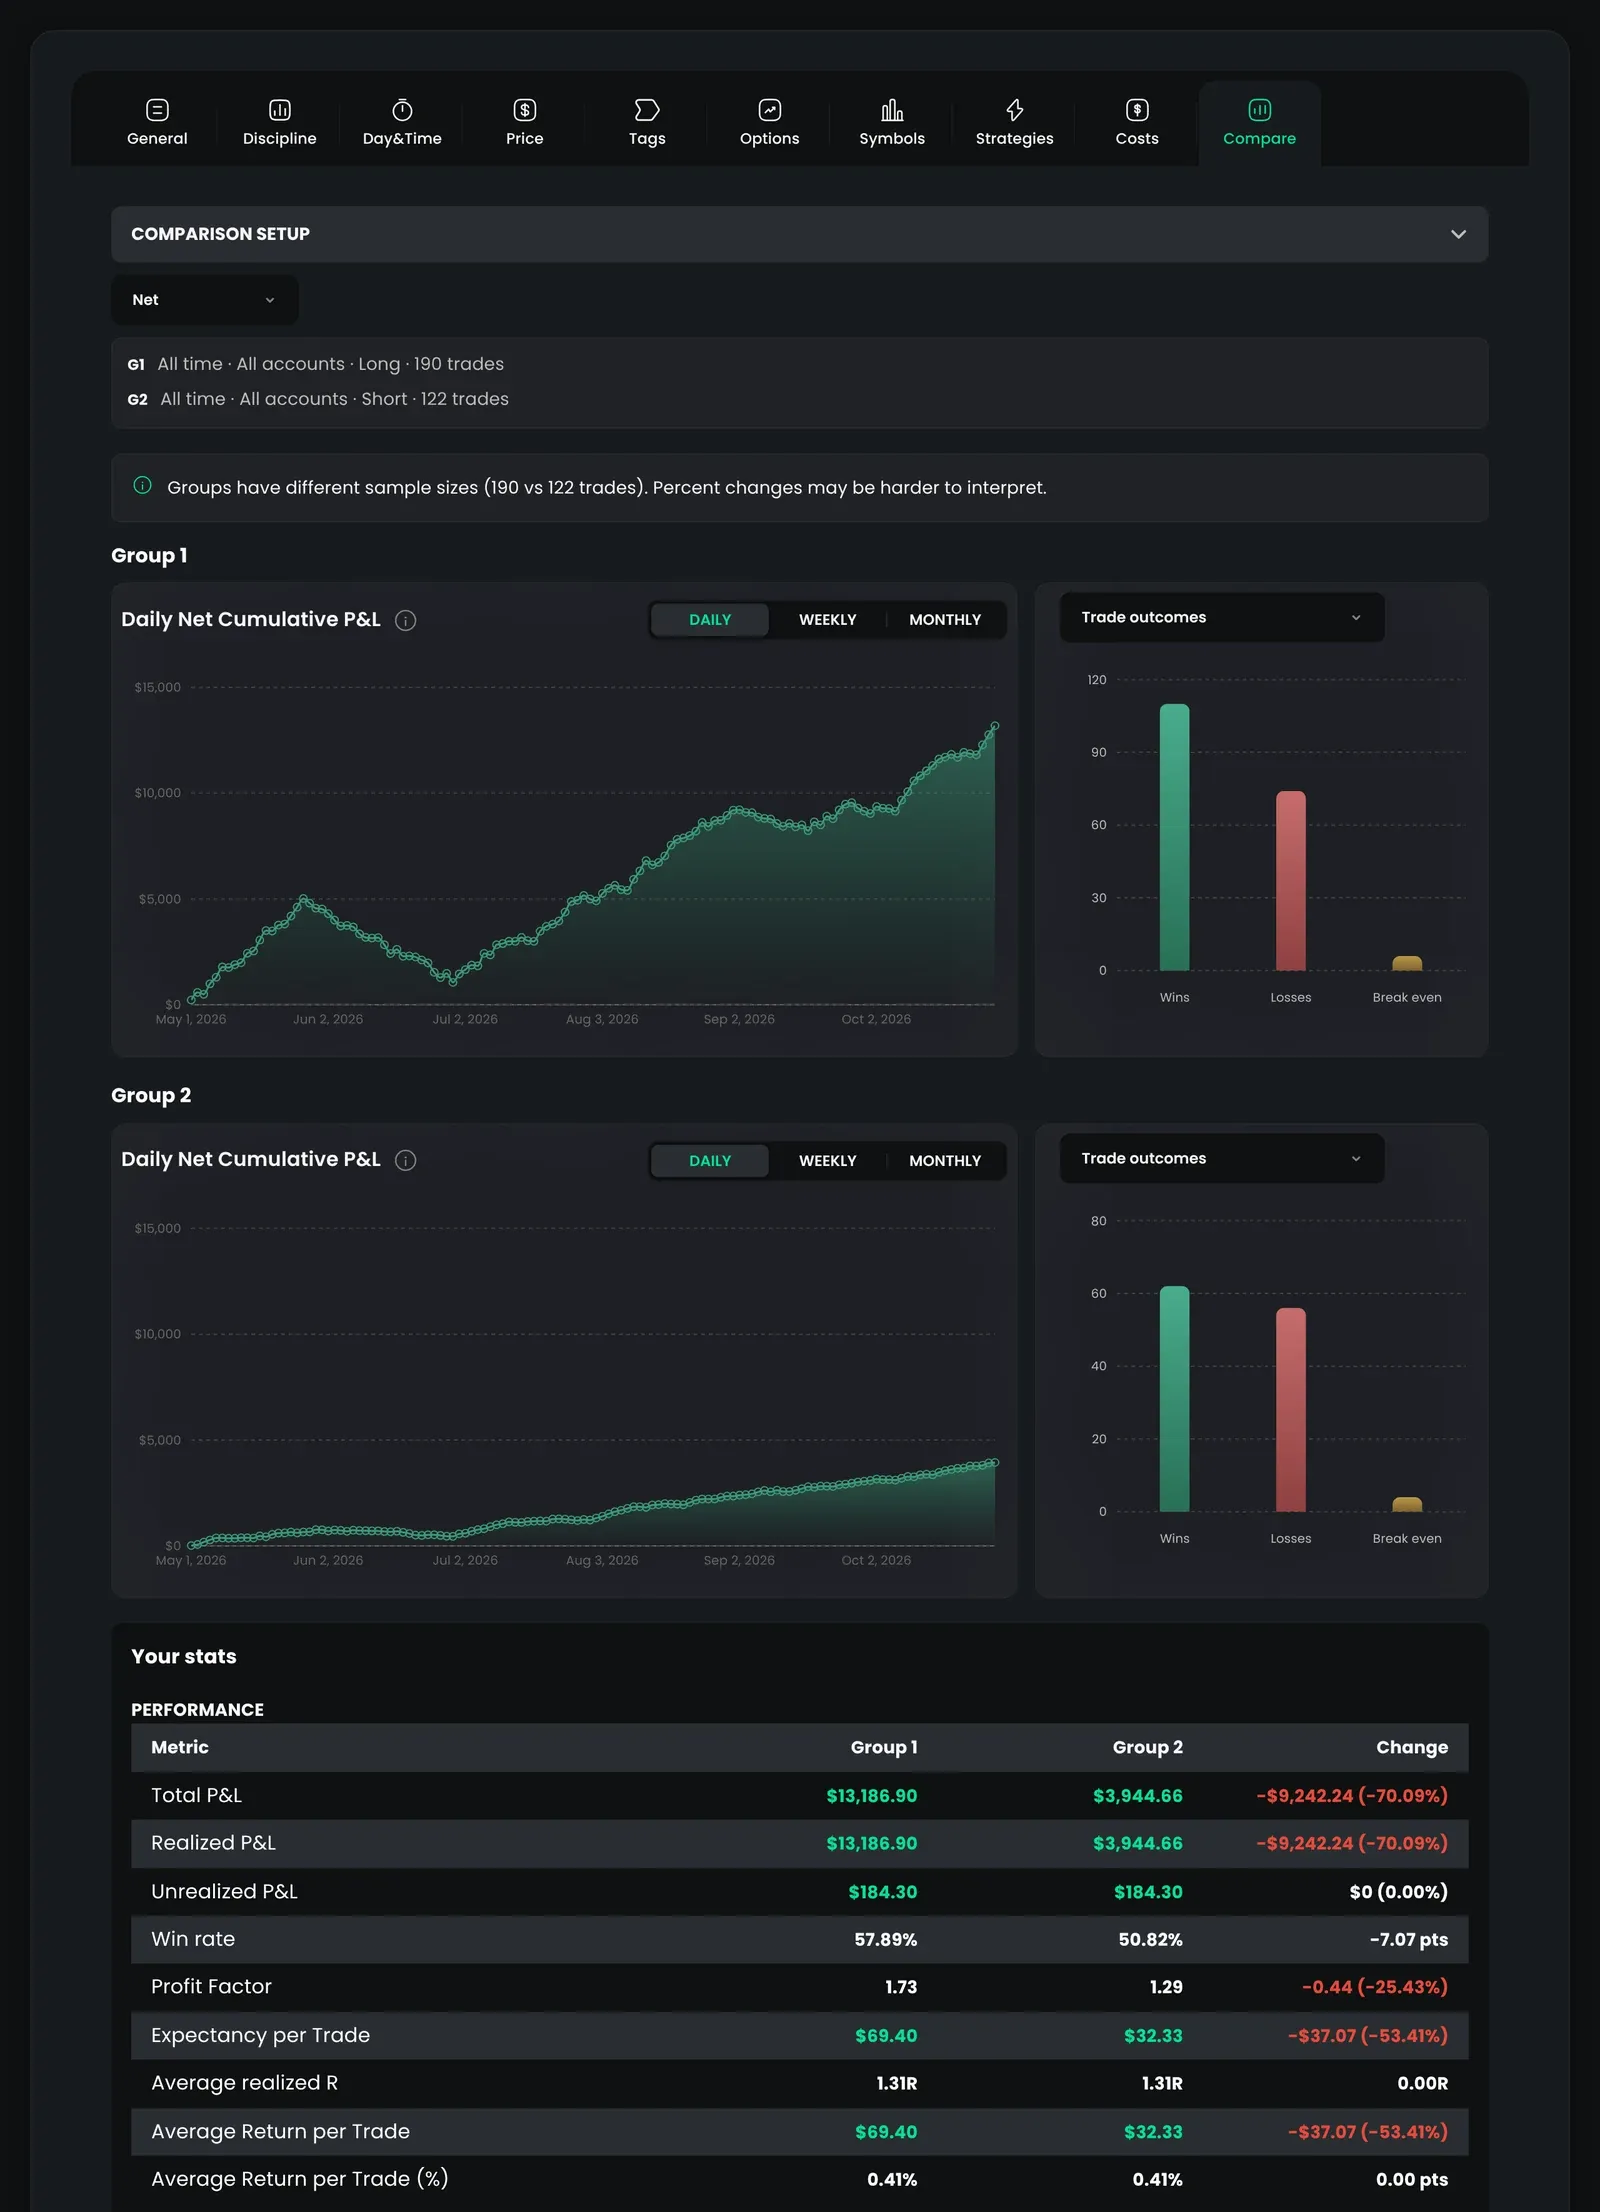
Each group gets its own row of charts:
- Net Cumulative P&L — cumulative P&L over time for the group. Switch between Daily, Weekly, and Monthly. Both groups share the same Y axis, so the lines are directly comparable.
- An outcome chart you can switch between Trade outcomes (wins, losses, break even), Average win vs loss, and Largest profit vs loss. The chart you pick and the bar/line view apply to both groups.
Metrics table
Section titled “Metrics table”Under Your stats, metrics are grouped into Performance, Risk, Consistency, Averages, Trade counts, Costs, and Highlights — the same metrics as the General report.
Each row shows Group 1, Group 2, and Change:
- Change is Group 2 minus Group 1.
- For money and other number values, the change also shows a percent of the Group 1 value. The percent is hidden when Group 1 is zero or very small, because it would be misleading.
- For percentage metrics (such as Win rate), the change is shown in points (pts).
- Text values (such as Most Traded Symbol) show — instead of a change.
On mobile, sections are collapsible and the columns are labeled G1, G2, and Change.
Hints and empty states
Section titled “Hints and empty states”- “Set both groups, then generate” — shown until you generate a report.
- “One group has no trades. Stats for that group will be empty.” — one side matched no trades.
- “Groups have different sample sizes (X vs Y trades). Percent changes may be harder to interpret.” — the groups have different trade counts.
- “No trades to compare” — neither group matched any trades. Try different values or accounts.
- Change one thing at a time. Keep the same accounts and dates and vary only the tag, side, or strategy, so the difference has one cause.
- Watch the sample size hint. A big percent change on a handful of trades is not a pattern yet.
- Use Long vs Short first — it is a quick check for a side you should trade smaller or skip.
- Compare a tag such as a mistake tag against the rest of your trades to see what it costs — Tags and categories
- Compare two strategies over the same dates to see which playbook pays — Strategy performance